National Renewable Energy Laboratory (NREL)
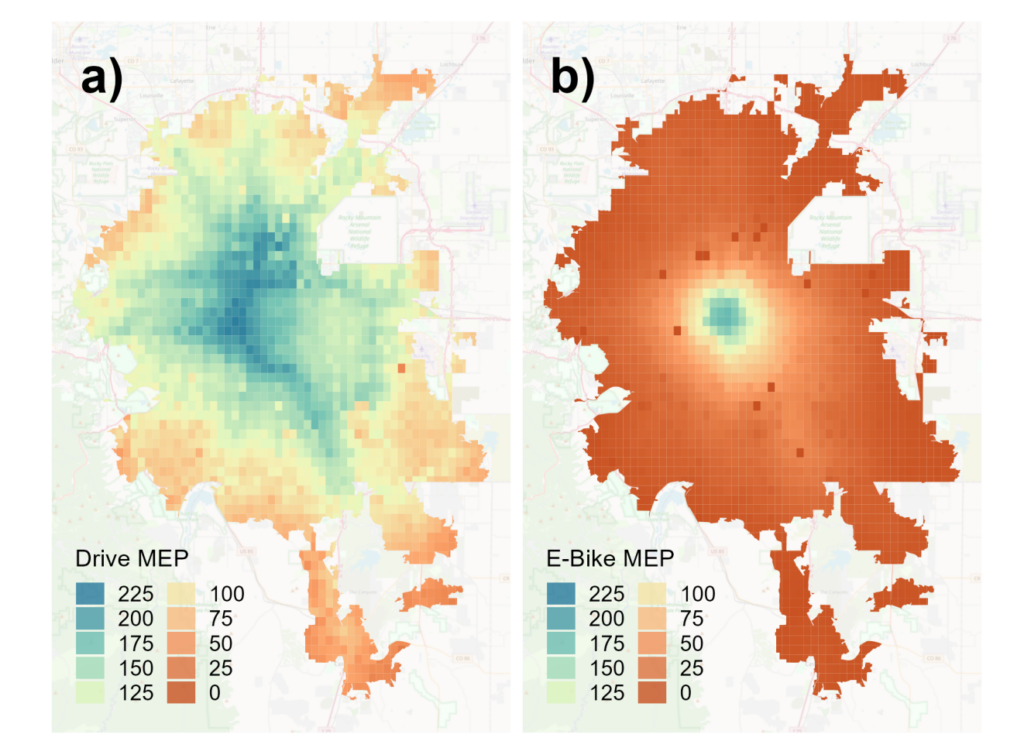
In 2022 I joined NREL as part of the Department of Energy’s Summer Undergraduate Laboratory Internship (SULI) program. I quantified the effectiveness of an e-bike pilot program in Denver, CO, using the novel Mobility Energy Productivity (MEP) metric and live trip data from an open-source mobile application (OpenPATH). Analyzed open source travel data using Pandas in Python. Contributed data analysis and visualization code to the OpenPATH code repository. I was second author on a paper published in the Transportation Record Review (TRR) Journal, and presented a poster at the Transportation Research Board (TRB) annual meeting 2023. Below is a comparison of the MEP scores for car and bike users in the city of Denver, CO using data collected from OpenPATH.

National Institute of Standards and Technology (NIST)
I was a participant in the 2021 Summer Undergraduate Research Fellowship (SURF) program, where I helped develop and test a novel calibration procedure for a triaxial Arduino MEMS accelerometer and gyroscope. This required designing and building a pendulum to excite and calibrate the device uner dynamic conditions. I then wrote scripts in Python, Jupyter Notebook, R, and Arduino to automatically analyze device readings, and used Mathematica and SymPy to develop an uncertainty analysis for the gyroscope’s sensitivity. I then used these device readings to improve the pendulum’s design to better capture precision calibration. An example of our timeseries data is shown below.

Hamilton College
Prior to joining Wesleyan’s physics department as a PhD student, I was an undergraduate at Hamilton College, where I earned a physics BA and math minor. My undergraduate thesis was titled “Analysis of Magnetic Rayleigh-Taylor Instability and its Effect on Angular Momentum Transport in a Black Hole Accretion Disk.” Prof. Megan Smith was my advisor.

As part of my senior thesis, I analyzed data from a simulated accretion disk surrounding a spinning black hole in an intense magnetic field. I used Python to render visual representations of plasma density and B-field strength, which you can see above as timeseries data. You can read my senior thesis as a pdf below.

